Glass.AI Helps to Monitor the Startup and Scaleup Ecosystems of OECD Countries and Brazil.
The ScaleUp Institute has leveraged our AI research capability and published new figures on the total number of startups, growing startups and scaleups across OECD countries and Brazil.
Understanding how countries compare in their ability to generate and expand young firms is increasingly important for policymakers, investors, and researchers. Using our evidence-led AI technology, the Institute has compiled, for the first time, comparable data on the total number of startups, growing startups, and scaleups across all OECD countries plus Brazil. Our AI identified and classified companies by reading millions of company websites, social media (e.g. LinkedIn) and official sources.
The study is tracking five key indicators:
Total startups.
Startup density (startups per million people).
Growing startups (3-year growth cohort).
Total scaleups.
Scaleup density (scaleups per million people).
This article provides a comparative view of the data, focusing on where the United Kingdom sits relative to all other countries in the dataset.
1. Total Startups: Dominated by a Few Countries
Across all countries in the dataset, startup populations vary dramatically, largely reflecting differences in economic size, population, and maturity of the business environment.
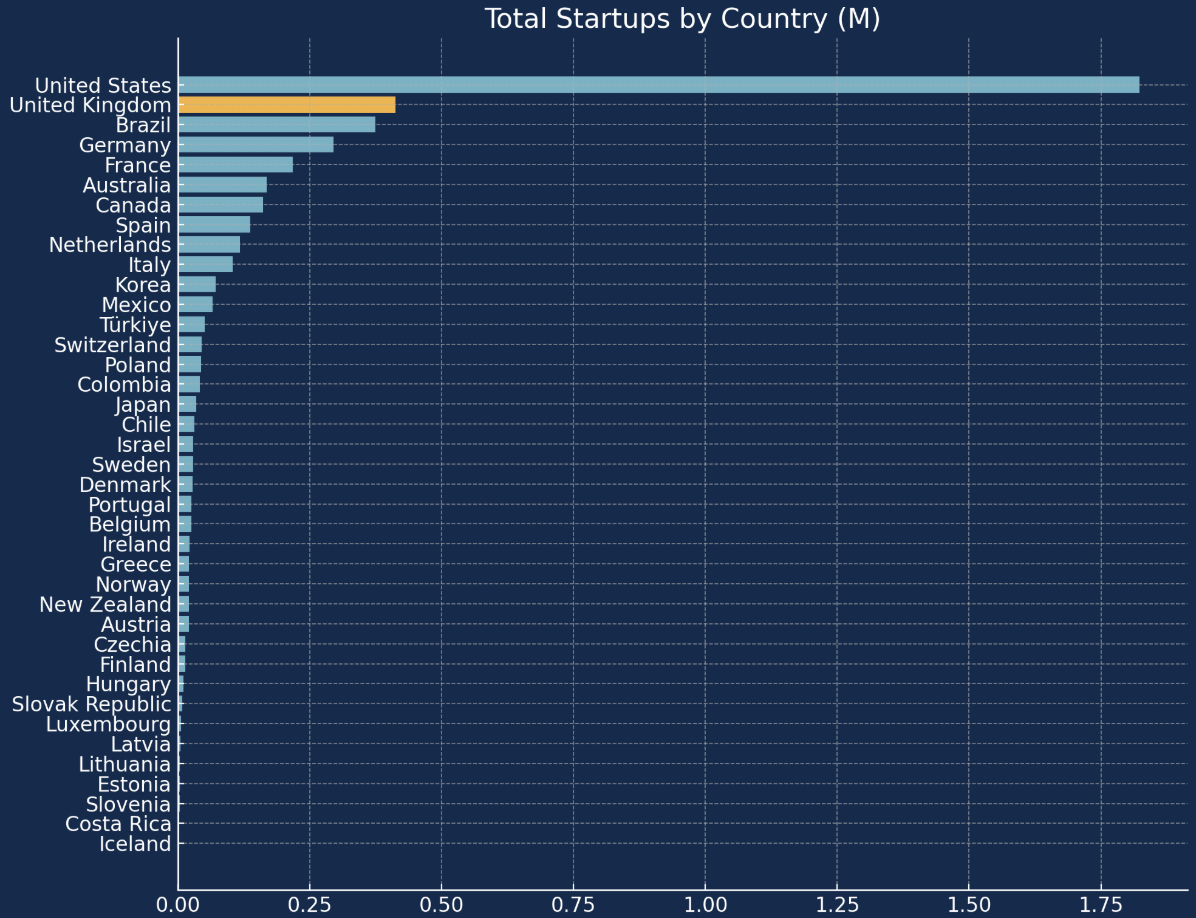
The UK ranks 2nd for the total number of startups.
Only one country, the United States, has a larger startup population.
Several countries with larger populations rank below the UK.
This suggests that the UK’s entrepreneurial activity is high not just in proportion to its size, but also in absolute terms.
By contrast:
Mid-sized OECD economies (e.g., the Netherlands, Belgium, Sweden, and Canada) tend to cluster in the mid-range.
Smaller countries predictably show smaller totals, but often outperform on density measures (discussed below).
2. Startup Density: Distinct Clusters
Startup density, defined as the number of startups per million inhabitants, reveals a different hierarchy, less dependent on population size and more reflective of entrepreneurial intensity.
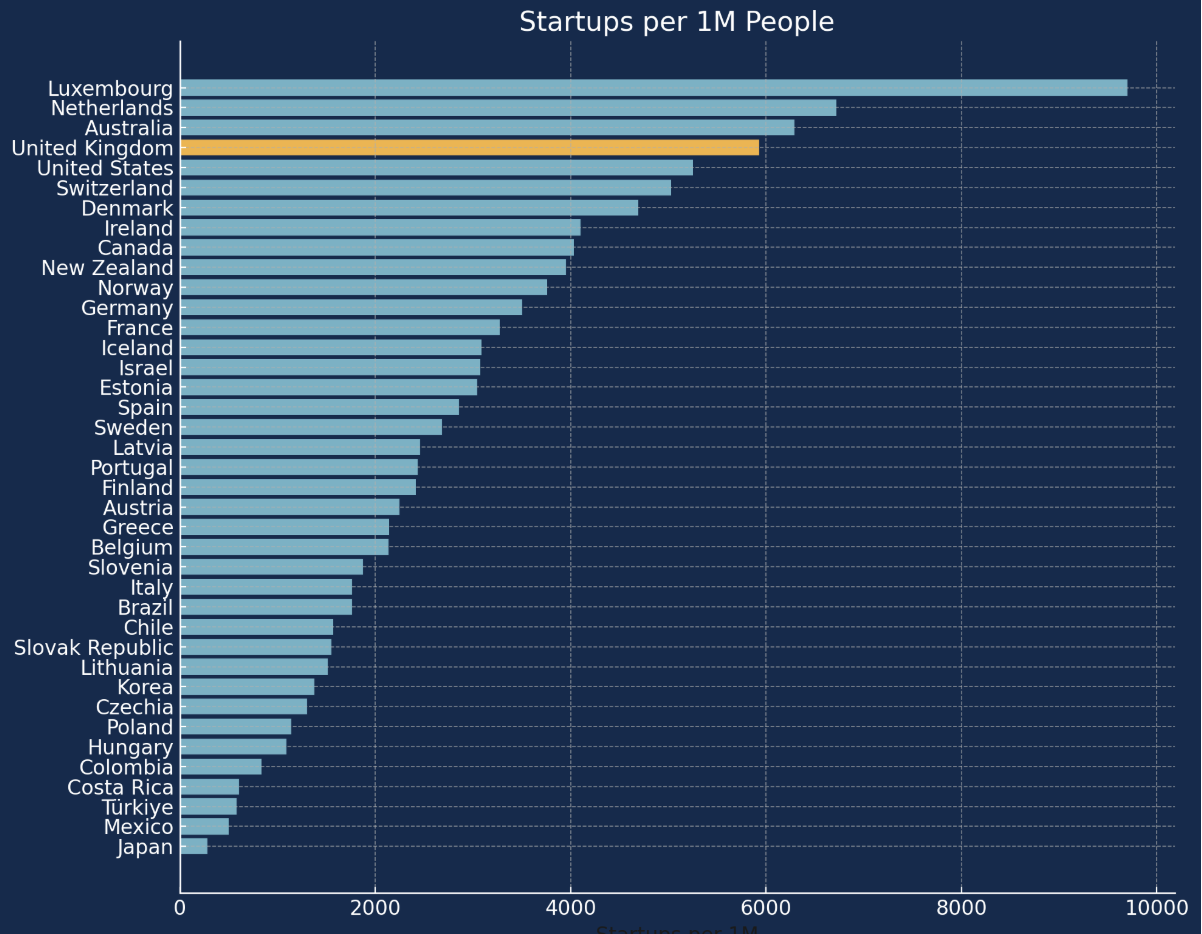
The UK ranks 4th, placing it in a high-intensity group alongside a small number of top-performing ecosystems.
Compared to other country clusters:
High-intensity small and mid-sized economies
The UK sits just below this group. Examples include Nordic countries, Estonia, Israel, and some other highly innovation-focused economies.Upper-mid intensity economies (many OECD members)
Here, the UK clearly outperforms, often at 1.5× to 3× their density.Lower-intensity ecosystems
These are often larger economies where startup activity is more diffuse.
The UK’s position is high, but not at the very top, suggesting an ecosystem that combines scale with substantial entrepreneurial concentration.
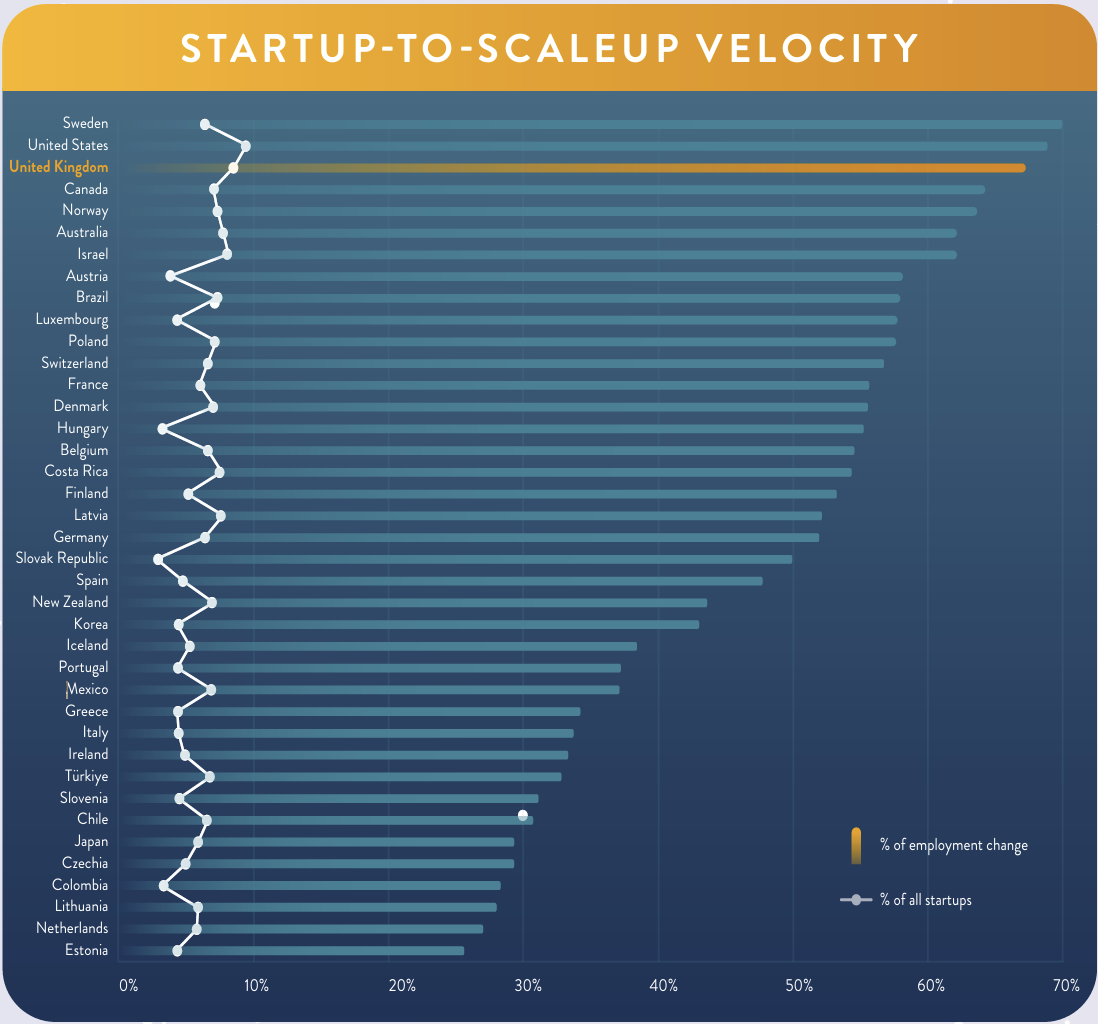
3. Growing Startup-to-Scaleup Velocity
One of the key metrics for the study was to quantify the number of growing startups — that is, firms that have shown multi-year growth over the last three years, reached 10 or more employees, and moved beyond the initial formation stage.
The UK ranks 2nd in the OECD for growing startups. This position indicates a strong early-stage progression relative to other countries. While some larger economies may generate many startups, the proportion that transitions into sustained growth seems to vary widely.
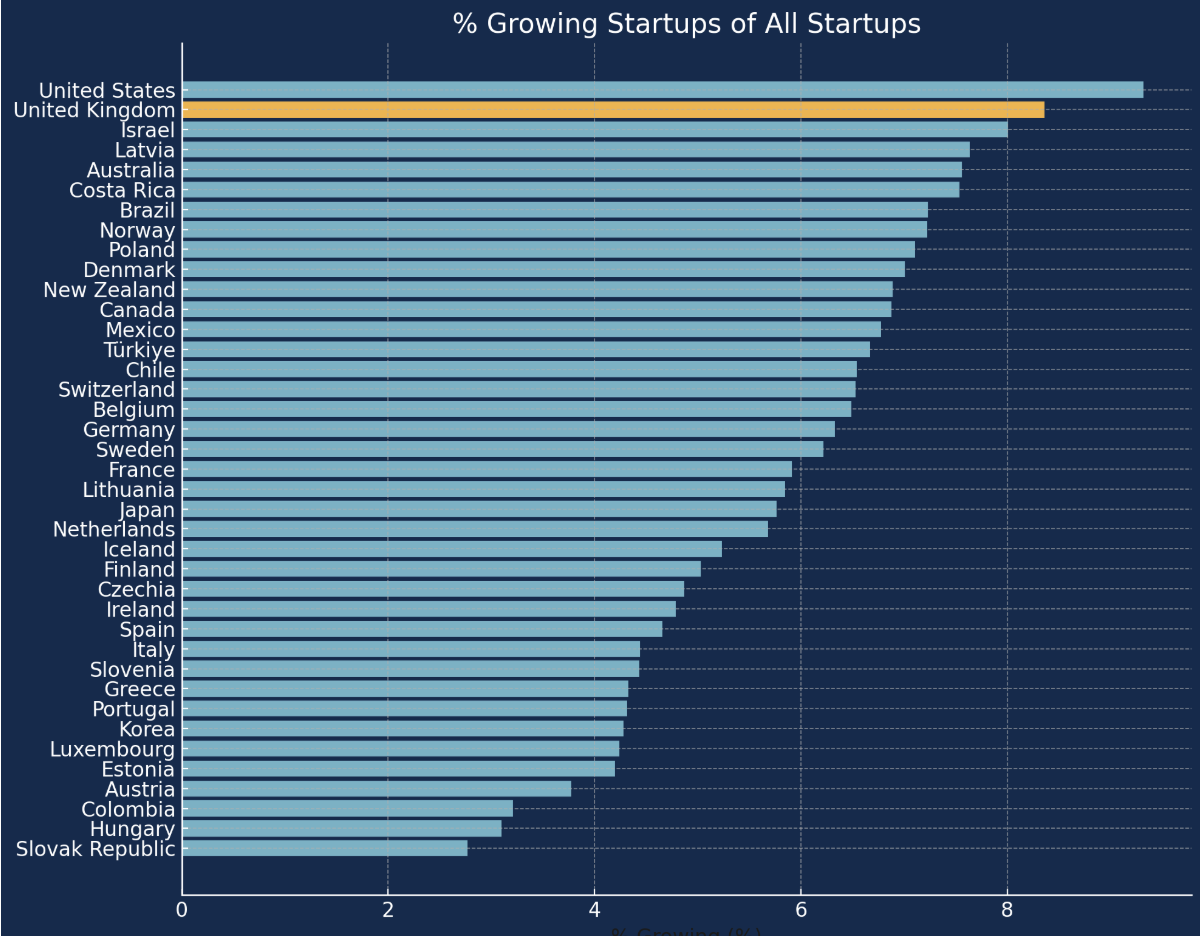
We noticed some patterns in the data:
The UK produces far more ‘growing startups’ than most OECD countries, often 3× to 10×.
However, a small number of countries outperform the UK, but they tend to have either substantially larger populations or unusually high early-stage acceleration cultures.
This metric suggests that the UK is not only generating startups but is comparatively effective at nurturing them through their first growth stages, and some of them even become scaleups.
Moreover, eleven years on from a study published by the OECD, the ScaleUp Institute has, for the first time, applied our enhanced, AI-driven approach to update the OECD’s methodology and reassess global performance. The analysis shows that in 2025, the UK’s scaleup ecosystem has made substantial progress over the past decade and now ranks third in the world for startup-to-scaleup velocity.
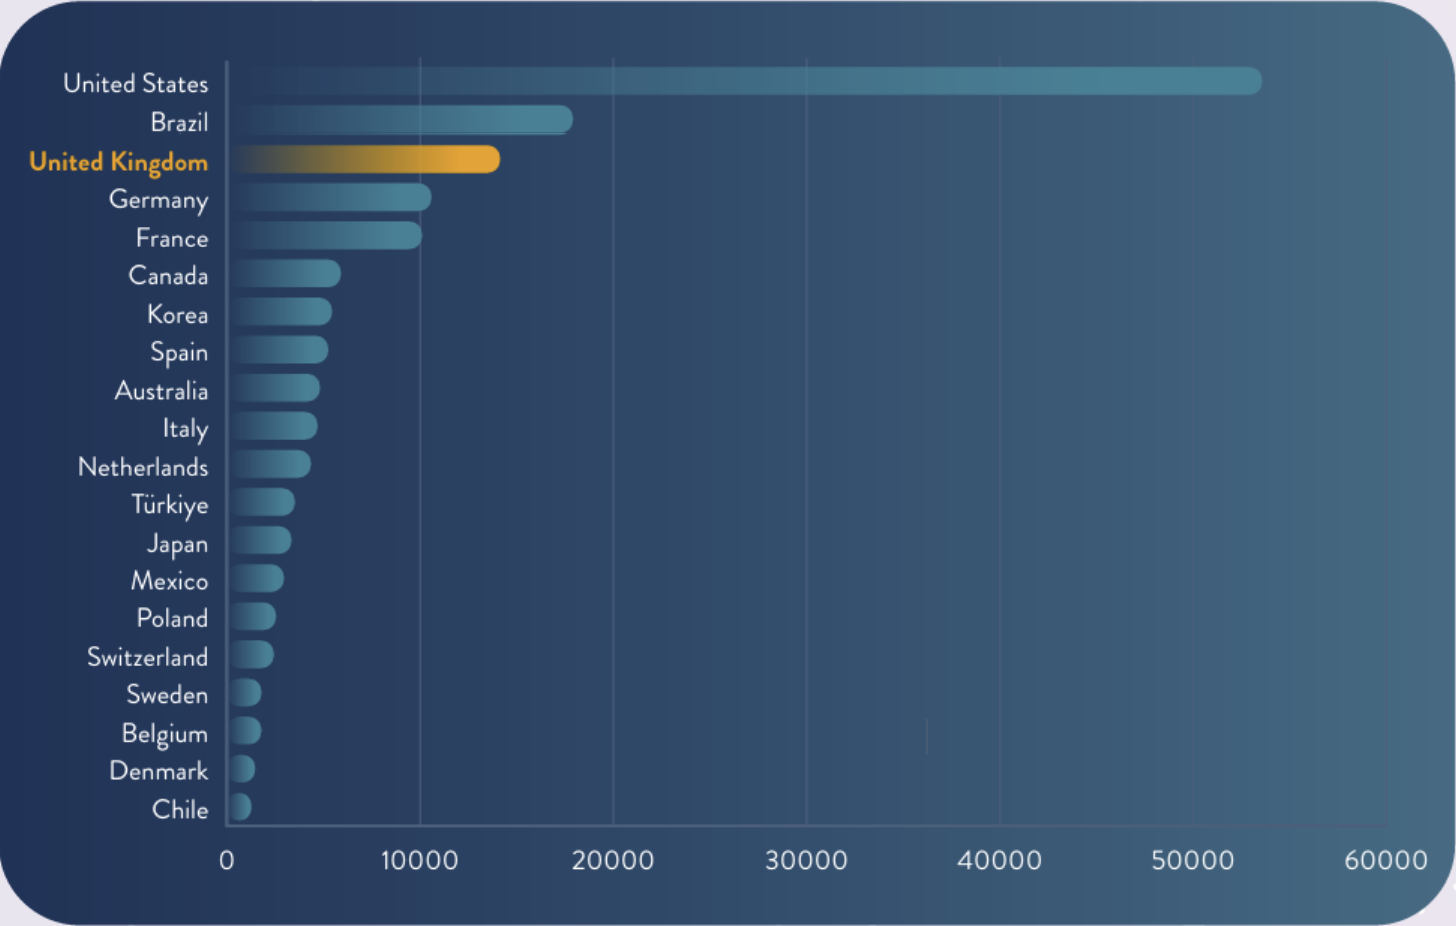
4. Scaleups: Updating Last Year’s Numbers
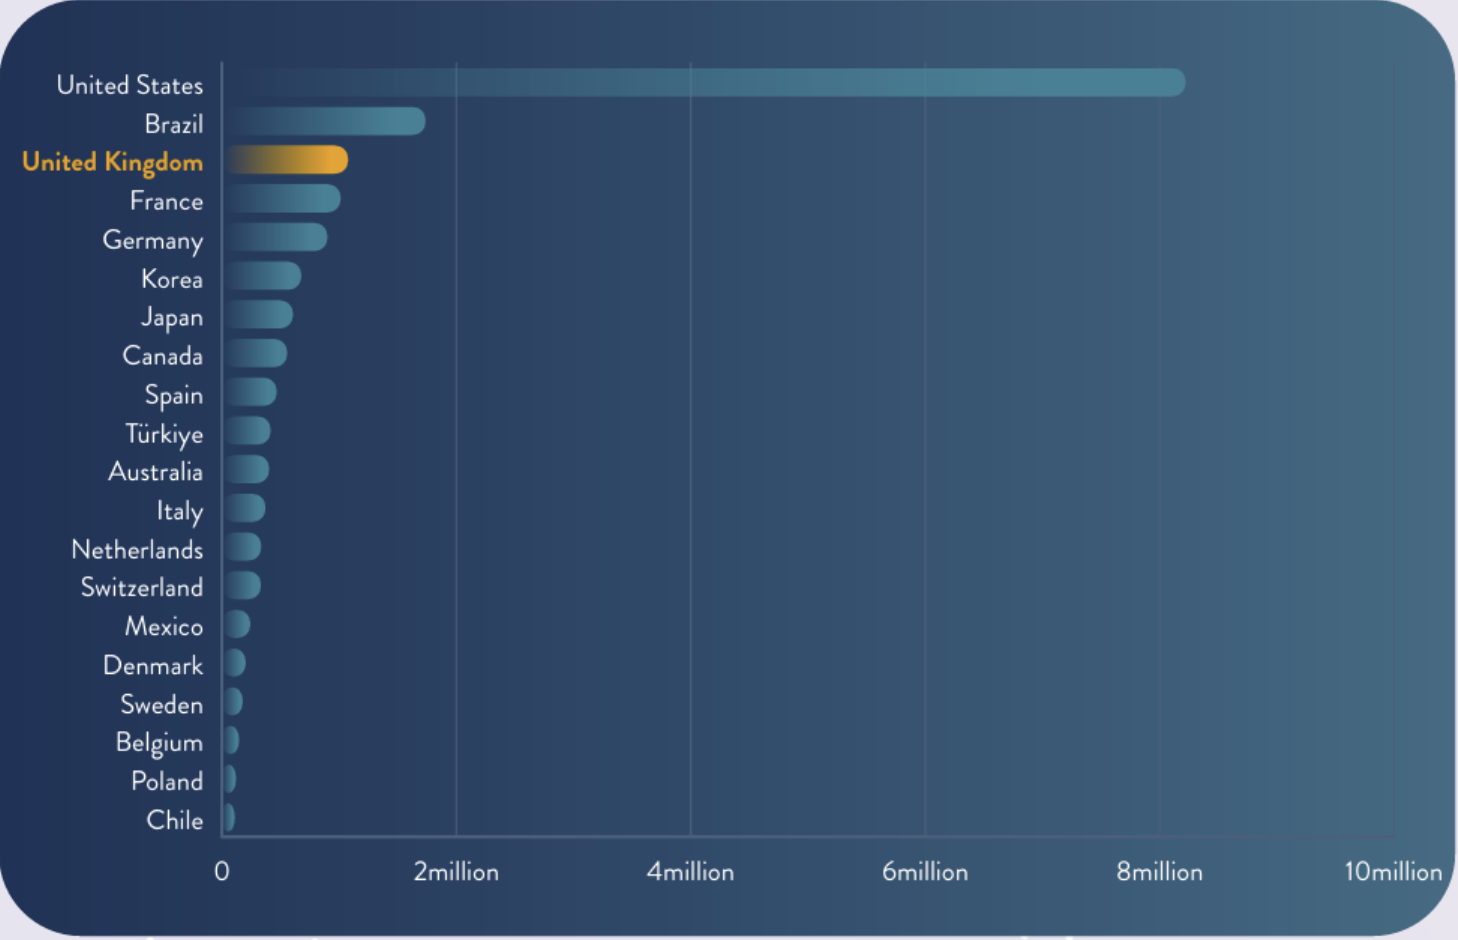
The research also examined scaleups: firms with 10+ employees that grew at 20% annually over three consecutive years. Scaleups mark the point at which ecosystems begin to produce significant economic impact, measured in jobs created and other measures.
The UK remains 3rd in total number of scaleups (same as last year). It sits behind only two countries, the United States, being huge, and Brazil. This places the UK clearly among the top-performing scaleup ecosystems in the dataset for producing firms that reach sustained high growth.
In terms of scaleups density per million people, this offers a different lens: the UK ranks 4th, indicating strong- though not the highest- scaleup intensity. The top few countries tend to be smaller, highly specialised ecosystems where a small absolute number of scaleups translates into a high population-adjusted figure.
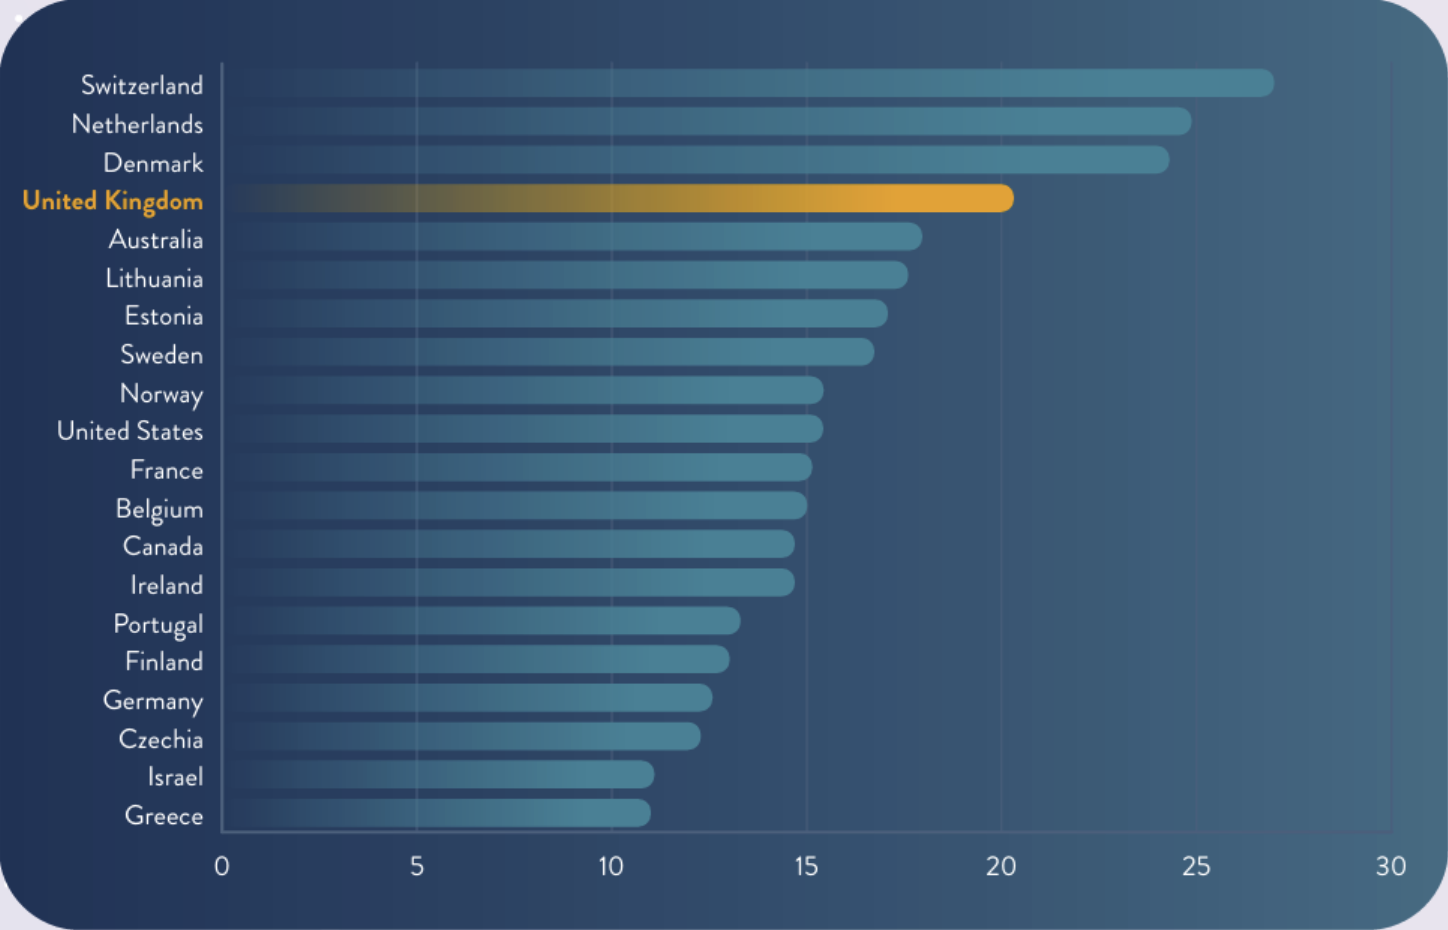
The UK’s combination of high absolute numbers and high density is notable. Few countries combine both dimensions; most excel in one at the expense of the other. However, as discussed in previous research, the UK (and other European countries) struggles to turn the scaleups into the huge success stories we’ve seen in the United States.
In terms of the number of jobs created by scaleups, the UK is also in third place behind the US and Brazil.
5. The UK’s Overall Position
In summary, across all metrics analysed, the UK consistently ranks within the top five countries, often within the top three. More importantly, the UK does so across both absolute and population-adjusted measures.
This places the UK among a small group of countries that demonstrate high startup formation, strong early-stage growth, and effective transition into Scaleup status. The fact that these rankings hold across five separate indicators signals broad systemic strength rather than isolated outperformance in one part of the pipeline.
Other countries show strengths in particular areas — some in density, some in absolute scale, some in scaleup efficiency — but few perform consistently across the entire lifecycle of firm creation, growth, and scaling.
This multi-metric benchmarking has not been conducted for many years, and previous methods were opaque, relying on surveys and disparate official statistics. The results suggest that the UK remains one of the most active and relatively high-performing innovation ecosystems across the OECD.
Get in touch if you want to learn more about our Startup and Scaleup discovery and tracking capabilities: info@glass.ai.